Simple Effects for Repeated Measures ANOVA Design
Question on Repeated Measures T-Test
To address your question, let’s take the first results from the Excel spreadsheet. Here you compare the levels within order when proc = 1 (that is, subsetting dataset on proc = 1). The results you obtain are the following.

This t-value is based on a One-Way ANOVA. You can check this by running a one-way ANOVA in SPSS. Here are the results:
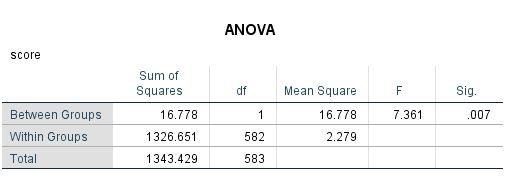
where sqrt(7.361) = 2.713 and the df = 582 (from the within or error term in the F-test) and identical p-value = .007. This one-way ANOVA however is not accounting for the dependencies in the repeated observations (the correlation between the two observations, in other words, is zero, despite the fact that both observations come from the same individual). Here is mixed ANOVA from the same model that considers dependency between the repeated measures:
DATASET ACTIVATE HypocrisyProcOne_Long.
MIXED score BY order
  /CRITERIA=CIN(95) MXITER(100) MXSTEP(10) SCORING(1) SINGULAR(0.000000000001) HCONVERGE(0,
    ABSOLUTE) LCONVERGE(0, ABSOLUTE) PCONVERGE(0.000001, ABSOLUTE)
  /FIXED=order | SSTYPE(3)
  /METHOD=REML
  /PRINT=CORB DESCRIPTIVES  LMATRIX SOLUTION TESTCOV
  /REPEATED=time | SUBJECT(id1) COVTYPE(AR1)
  /EMMEANS=TABLES(OVERALL)
  /EMMEANS=TABLES(order) COMPARE ADJ(LSD).
Here are the results:
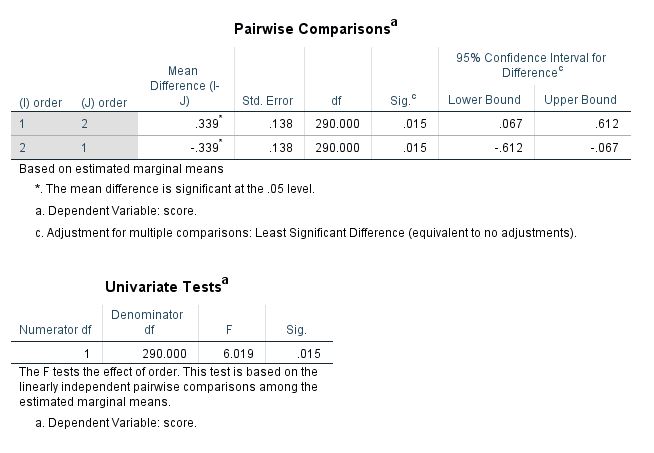
where sqrt(6.019) = 2.453 and the df = 290. This model accounts for the dependency of the observations. The same results can be reproduced with the nlme in R:
library(nlme)
setwd("C:/Users/Mark V. Brow/Desktop/Repository11/markbrow.github.io")
HypocrisyProcOne<-read.csv("HypocrisyProcOne_Long.csv",header=TRUE, sep=",")
colnames(HypocrisyProcOne)<-c("id1","id","proc","order","time","score")
lme_proc = lme(score ~ order, data=HypocrisyProcOne, random = ~1|id1)
anova(lme_proc)
## numDF denDF F-value p-value
## (Intercept) 1 292 2329.7704 <.0001
## order 1 290 6.0189 0.0147where t(290) = 2.453, p = .015 . Incidentally, we can obtain the same results by specifying a contrast test in SPSS:
DATASET ACTIVATE HypocrisyProcOne_Long.
MIXED score BY order time
   /FIXED=order time order*time
  /METHOD=REML
  /PRINT=CORB  LMATRIX SOLUTION TESTCOV
  /REPEATED=time | SUBJECT(id1) COVTYPE(AR1)
  /TEST = 'order test' order .5 -.5 order*time .25 .25 -.25 -.25.
/Execute.
Here is the result from the contrast test:
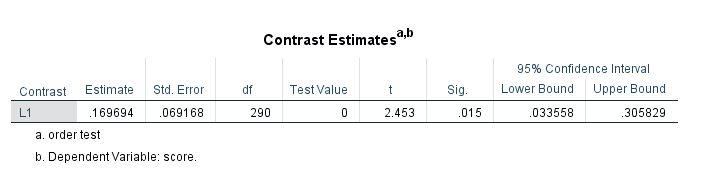
This same result, t(290) = 2.453, p = .015, is obtained with the F-test from the mixed command above, as well as the result from the nlme package. Notice that the contrast test in SPSS explicitly provides a t-value along with corresponding df.
Summary
In summary, the results you have obtained are based on a one-way ANOVA that does not account for the dependency in the repeated observations. The mixed models presented here do account for the dependency in the repeated observations. You may want to run the nlme function on the data to obtain revised estimates. I could help you with this if you would like.